How to pick between RICE, WSJF, ICE and MoSCoW
RICE vs WSJF vs MoSCoW vs ICE, scored on the same twelve backlog items, with the arithmetic, a decision rule, and where each framework quietly breaks.


The meeting where the loudest voice won
You have twenty two open items and room for six. Someone says "customers keep asking for this" with real conviction, nobody has a number to argue back with, and it ships two weeks later to about forty people.
A scoring framework stops that, mostly. The awkward part is choosing one, and most write-ups define all four then decline to recommend any.
Short answer. RICE when you have usage data and the list is all product work. WSJF when it holds infrastructure, compliance, or risk work. ICE when you have neither data nor an hour. MoSCoW when the audience is a client who needs a scope commitment.
Below, one twelve item backlog scored all four ways. Disclosure: we build a tracker with no formula field, so the last two sections cover computing a score elsewhere and writing it back. Ranking mechanics live in how to prioritize your backlog.
The four, and what each one asks you for
| Framework | Formula | What you must know | Output scale |
|---|---|---|---|
| RICE | (Reach x Impact x Confidence) / Effort | People touched per period | Unbounded, reach dominates |
| WSJF | Cost of Delay / Job Size | What a week of waiting costs | Bounded, roughly 1 to 40 |
| ICE | Impact x Confidence x Ease | Nothing. Three opinions | 1 to 1000 |
| MoSCoW | None. Four buckets | What makes a release pointless | Four labels |
Two definition mistakes do most of the damage. RICE's impact is not a 1 to 10 score. It is a multiplier from five fixed values: 3 massive, 2 high, 1 medium, 0.5 low, 0.25 minimal. Confidence is a percentage and effort is person-months, both per Sean McBride's original Intercom post. Use 1 to 10 instead and every number is wrong by an order of magnitude.
WSJF's cost of delay is three relative scores added: business value, time criticality, risk reduction. It and job size both use the modified Fibonacci scale 1, 2, 3, 5, 8, 13, 20, anchored by giving the smallest known item a 1.
MoSCoW carries a rule almost nobody applies. The DSDM handbook caps Must at no more than 60 percent of delivery effort and holds around 20 percent in Could as contingency. Must stands for Minimum Usable SubseT: without it, there is no point deploying on the date.
The same twelve items, scored four ways
Reach is users per quarter, effort is person-months, rank is in brackets. ICE is impact times confidence times ease, each 1 to 10. WSJF is value plus time criticality plus risk reduction over job size, all Fibonacci.
| Issue | R | I | C | E | RICE | ICE | WSJF | MoSCoW |
|---|---|---|---|---|---|---|---|---|
| WEB-14 checkout 500s | 900 | 3 | 100% | 0.5 | 5400[1] | 810[1] | 41.0[1] | Must |
| WEB-19 bulk edit | 2400 | 1 | 80% | 1.0 | 1920[2] | 336[4] | 6.5[4] | Should |
| WEB-27 dark mode | 3000 | 0.25 | 100% | 0.5 | 1500[3] | 270[5] | 4.0[7] | Could |
| WEB-52 mobile nav | 1800 | 0.5 | 80% | 0.5 | 1440[4] | 360[3] | 7.0[3] | Should |
| WEB-35 digest email | 1500 | 0.5 | 80% | 1.0 | 600[5] | 224[6] | 3.5[9] | Could |
| WEB-44 onboarding | 2000 | 0.5 | 50% | 1.5 | 333[6] | 150[11] | 2.7[11] | Could |
| WEB-23 offline mode | 400 | 2 | 50% | 2.0 | 200[7] | 175[9] | 4.2[6] | Should |
| WEB-41 API rate limit | 40 | 3 | 100% | 1.0 | 120[8] | 420[2] | 10.5[2] | Must |
| WEB-31 Trello import | 180 | 2 | 50% | 2.0 | 90[9] | 180[8] | 3.7[8] | Won't |
| WEB-12 SSO | 120 | 2 | 80% | 3.0 | 64[10] | 196[7] | 3.2[10] | Must |
| WEB-47 Gantt links | 300 | 1 | 50% | 4.0 | 38[11] | 50[12] | 1.1[12] | Won't |
| WEB-38 audit export | 60 | 1 | 80% | 1.5 | 32[12] | 160[10] | 5.3[5] | Should |
Only the RICE inputs fit in the table. Two rows in full: the checkout bug is ICE 9 x 10 x 9, WSJF (13 + 20 + 8) / 1. Audit log export is ICE 4 x 8 x 5, WSJF (5 + 3 + 8) / 3: little value, no urgency, and the highest risk reduction on the list. The MoSCoW column obeys the 60 percent rule too: Must is 4.5 of the 12.5 person-months in scope, Could is 24 percent.
One item, the checkout bug, comes first on all three numeric scores. After that they split, and not randomly. ICE and WSJF return the same top four in the same order; RICE shares three of them and ranks them differently. Spearman correlation is 0.80 between ICE and WSJF, 0.48 between RICE and WSJF.
RICE is the outlier for a mechanical reason. It multiplies by raw unbounded reach, so a 3000 user item beats a 40 user item on that term alone, while ICE and WSJF bound every input. RICE also has no risk term; WSJF carries risk reduction in its numerator.
Rate limiting the public API is second on ICE and WSJF and eighth on RICE. Audit log export is fifth on WSJF and dead last on RICE, a seven place spread. If your backlog holds platform, security, or single-customer work, RICE buries it and WSJF surfaces it. Let that decide before anything else here does.
How to pick
flowchart TD
  A["Who reads the output"] -->|"a client or an exec"| M["MoSCoW"]
  A -->|"the build team"| B["Do you have reach data"]
  B -->|"no"| I["ICE"]
  B -->|"yes"| C["Infra or compliance work"]
  C -->|"yes"| W["WSJF"]
  C -->|"no"| R["RICE"]
Reach data means analytics or support volume, not a guess with a decimal point on it. If you are inventing the figure, ICE is more honest and faster.
Team size matters less than people claim. Five people can run RICE. What they cannot do is keep thirty cost of delay estimates current every quarter, which is why WSJF collapses below roughly twenty engineers.
Where each one breaks
RICE breaks at the confidence column. It is the only input anyone can move without justifying it, so it becomes the fudge factor and the project someone already wants gets 80 percent instead of 50.
WSJF breaks because nobody knows their cost of delay. Don Reinertsen, who formalized the model in The Principles of Product Development Flow, put the share of product managers who cannot state theirs at about 85 percent, with intuitive estimates spreading fifty to one. If you cannot say what one more week of not having this costs, you are computing a feeling with a division sign in it.
A subtler WSJF failure we have not seen written up: its denominator is a bounded Fibonacci scale with a floor of 1, so it is not scale invariant. Halve every job size above, snap to the nearest Fibonacci value, and six of the twelve items change rank. Distinct sizes collapse from five values to three, and the hardest fallers are the two already at 1 with nowhere to shrink.
ICE, Sean Ellis's growth-experiment model, saturates from the other end. Ease caps at 10, so once a team is fast at everything, ICE becomes impact times confidence. MoSCoW breaks the moment nobody enforces the 60 percent rule: everyone marks their own item Must, you land at 95 percent Must, and the labels have told you nothing.
Does your effort column still mean anything
The claim doing the rounds is that AI agents made effort estimates worthless. Run it against the table above and it mostly does not survive.
A uniform speedup is invisible to RICE. Divide every effort estimate by the same number and every score multiplies by it, so the ranking is identical. A flat 2x across all twelve rows changed zero ranks.
Measured gains barely move anything either. Yegor Denisov-Blanch of the Stanford software engineering productivity group reports, from a dataset of roughly 100,000 engineers, about 30 to 35 percent on greenfield low complexity work and 0 to 10 percent on brownfield high complexity work. Apply those by category and 4 of the 12 items move one place, none in the top seven.
Inconsistency is what destabilizes a ranking. METR's May 2026 survey found a median self-reported speed change of 3x, against measured results of 18 percent for returning developers and 4 percent for new ones, both intervals straddling zero and both a likely floor given who opted out. Apply the believed 3x to the greenfield rows only and 10 of 12 items move. The threat is not agents getting faster, it is one team applying its beliefs unevenly across categories.
So re-score the one category whose assumption changed, once a quarter, in the review you already hold when you run sprints without the ceremony.
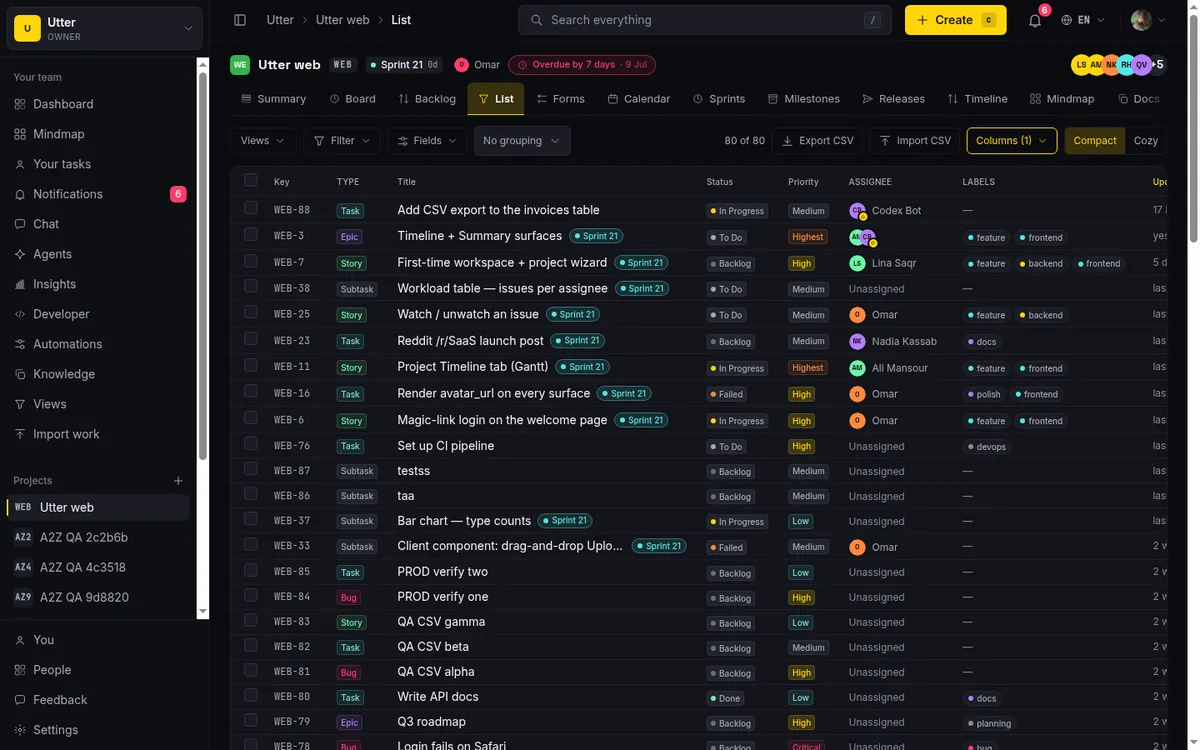
Where the score lives in your tracker
The inputs have to sit on the issue or they end up in a spreadsheet that goes stale in three weeks. In Taskfolk that means custom fields: ten kinds including number and select. Four number fields for RICE, three plus a size for WSJF, one select for MoSCoW, and one more for the score.
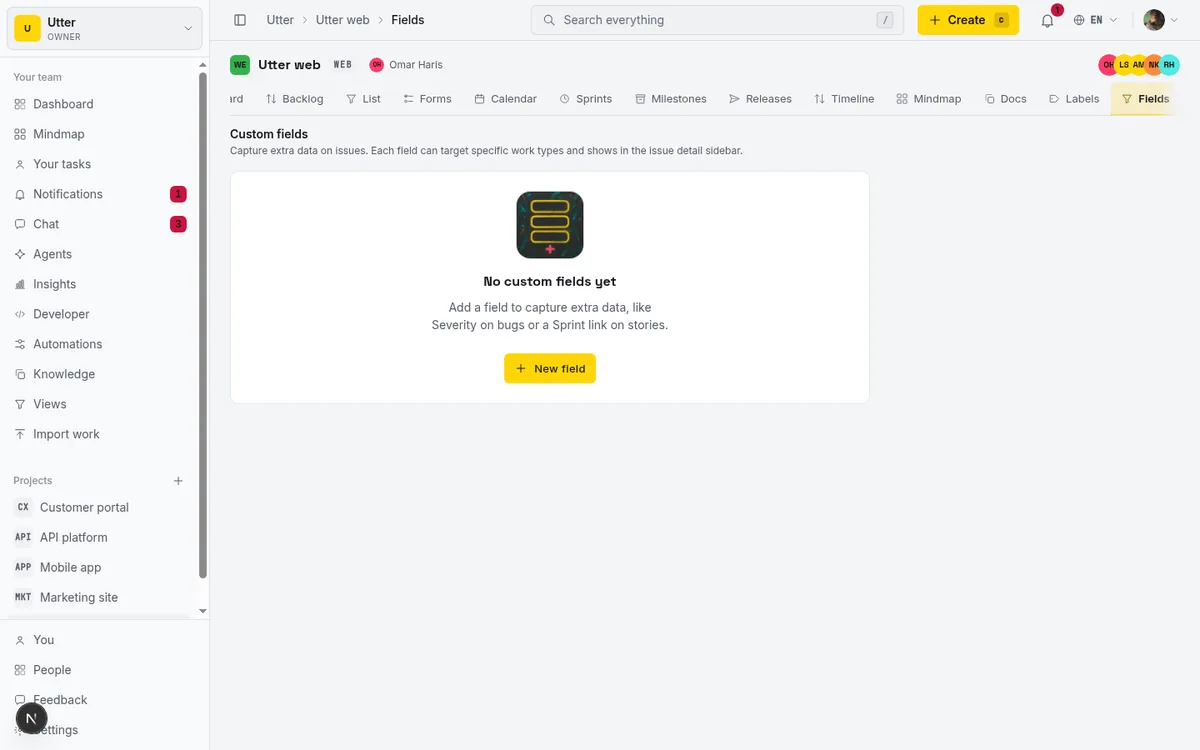
Nothing fills that last field in for you. Once it has values, a number field gets a min/max range filter in the List and Board filter panels, serialized into the URL as ?cf.<fieldId>=n:40.. for 40 and above, plus ?cols=<fieldId> for the column. Board, Backlog, List, Timeline and Calendar read the same parameters, so one link puts everyone on the same cut. How to filter and sort issues covers the rest.
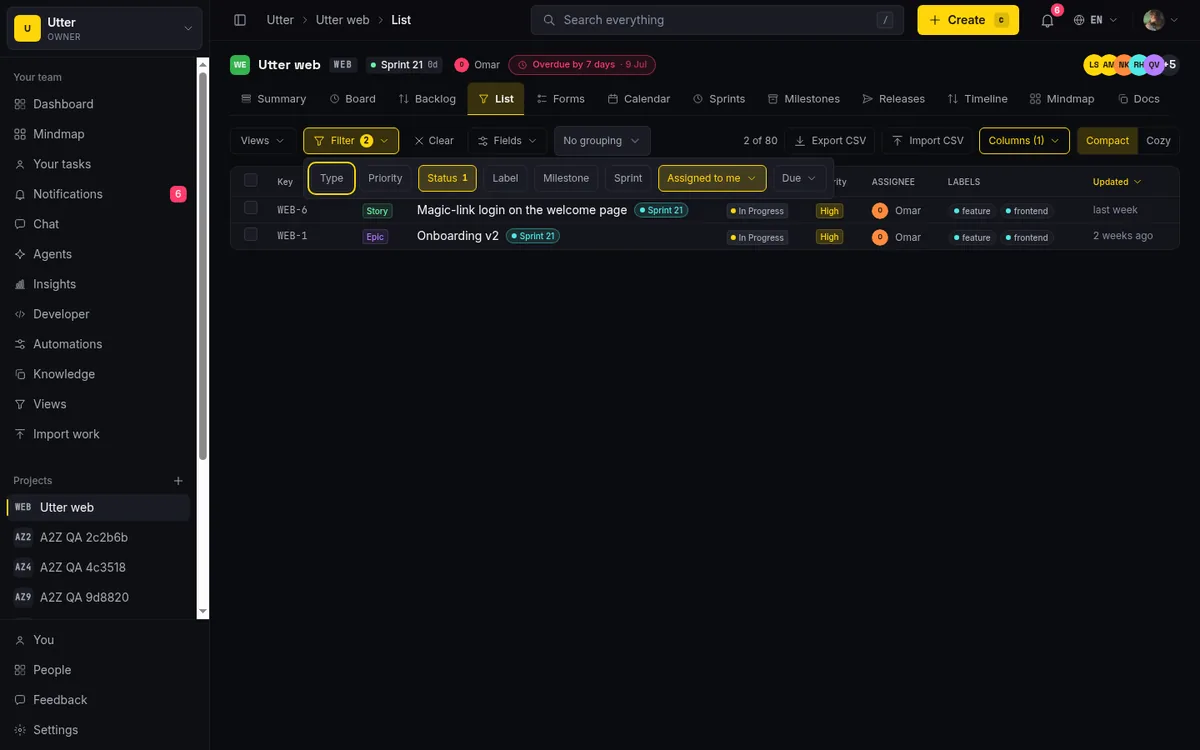
Three limits before you build a process on this. You cannot sort by a custom field anywhere: the List sorts on key, title, status, priority and updated date. A saved view cannot hold a custom-field filter either, because it persists types, priorities, statuses, labels and assignee. And the filter runs in the browser over rows already paged in, 100 at a time, so on a 900 item backlog "score above 40" sees only what you loaded.
The workaround is to map the score onto the built-in priority enum, which sorts and survives a saved view. A score is not a rank anyway: backlog order is a human call that can override any number. OKRs that roll up from real work covers the goal half.
Writing the score back, and what we do not do
One call per issue per field, and the response echoes the value that landed.
BASE="https://taskfolk.ai/api/v1/workspaces/acme"
curl -X PUT "$BASE/projects/WEB/issues/WEB-41/custom-fields/$FIELD_ID" \
  -H "Authorization: Bearer tfk_live_a1b2..." \
  -H "Content-Type: application/json" \
  -d '{"value": 10.5}'
{ "data": { "field_id": "e2b1...", "value": 10.5 } }Reading is the awkward half. The issue object carries no custom-field values, and the list endpoint takes no sort parameter and no custom-field filter, so a full re-score is: list the issues, one GET each, compute, one PUT each. Fine quarterly, not hourly.
Hand that loop to a connected agent, but scope the key rather than reaching for the per-agent field policy: that policy governs 14 built-in issue fields, none of them custom. A key with issues:read, custom_fields:read and custom_fields:write does the job. How to use the REST API covers keys and scopes.
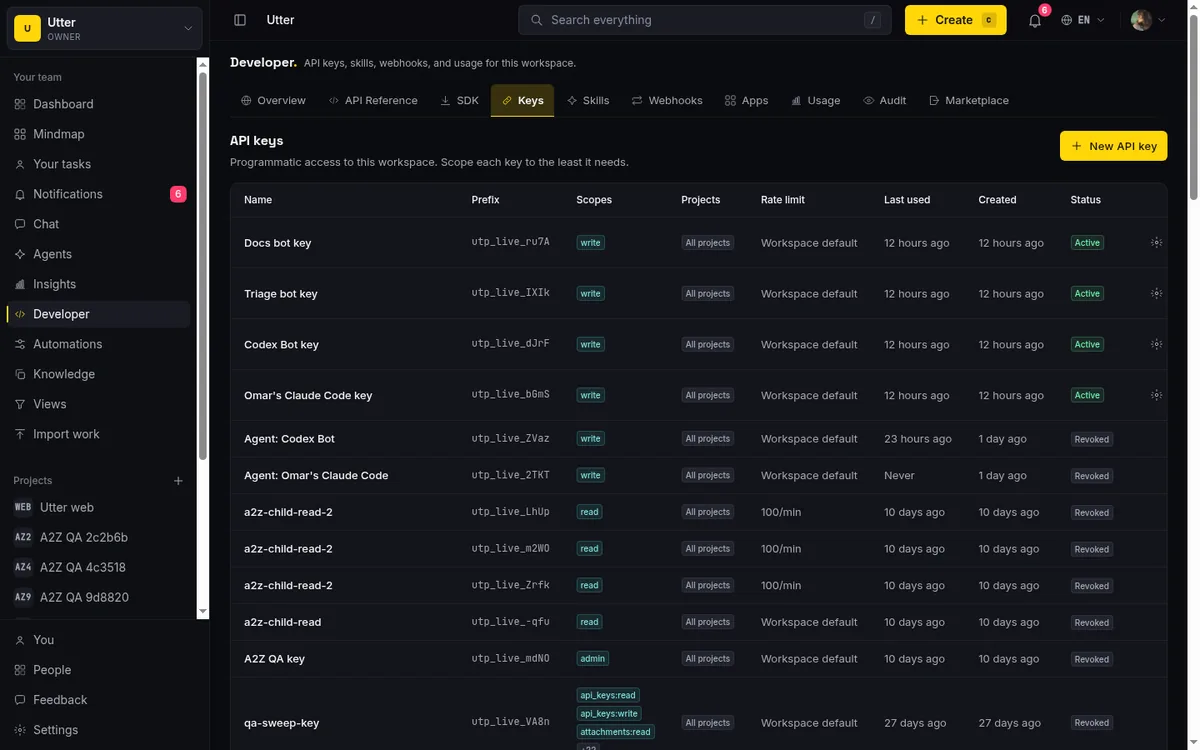
Two things we do badly. The custom-field API route writes no activity row, so a score written back by a script leaves no trace in the issue history; the same edit in the UI does. And there is no formula field at all, where Jira Product Discovery ships one that teams wire up for RICE, and ClickUp's supports IF, DAYS and ROUND.
| Tool | Formula field | Price, checked 27 July 2026 |
|---|---|---|
| Jira Product Discovery | Yes | $0 for 3 creators, then $10 or $25 per creator |
| ClickUp | Yes | $0, then $7 or $12 per user, billed yearly |
| Linear | No custom fields at all | $0, then $10 or $16 per user, billed yearly |
| Taskfolk | No | $0, then $3 or $6 per builder |
If a computed field inside the tool matters most, Jira Product Discovery is the better buy. What you get here is a cheaper seat, a real API for the write-back, and agents that never count as seats.
Pick one framework, define its fields on one project, and score ten items by hand before you automate anything. If the ranking makes you argue with it, the framework is doing its job.
Frequently asked questions
What is the difference between RICE and ICE?
ICE is Impact times Confidence times Ease, each scored 1 to 10 from opinion. RICE adds Reach as a real headcount and divides by Effort in person-months, and its Impact is a fixed multiplier (3, 2, 1, 0.5, 0.25) rather than a 1 to 10 score. RICE needs data; ICE needs ten minutes.
How do I calculate WSJF without a cost of delay number?
You do not compute an absolute cost of delay. You score three relative components on the modified Fibonacci scale 1, 2, 3, 5, 8, 13, 20: business value, time criticality, and risk reduction. Anchor each column by giving the smallest item a 1, then size everything against it. If you still cannot rank those columns, use ICE.
Which prioritization framework works for a team of five?
RICE if you have real usage numbers, ICE if you do not. WSJF tends to fall over below about twenty engineers, not because it is complicated, but because nobody has time to keep cost of delay estimates current for thirty items every quarter.
Should the framework score decide the order of the backlog?
No. The score is an input. A dependency, a customer commitment, or a fix that unblocks three other items all legitimately beat a higher score. Use the score to find the arguments worth having, then set the rank by hand.
How often should scores be recalculated?
Once a quarter, and only for the categories whose effort assumptions actually changed. Dividing every effort estimate by the same number multiplies every RICE score by that same number, so a uniform re-estimate provably changes no ranks. Only uneven changes between categories move a ranking.
Related reading
How to read the project summary
Read the Taskfolk project Summary tab like a pro: what every card shows, how each number is computed, what good looks like, and where the dashboard stops.
15 July 2026 · 16 min read
Monday.com alternatives built for software teams, not marketing ops
Monday.com alternatives for software teams: real pricing (3-seat minimum vs $3/$6 per builder seat), category-backed statuses, sprints with carryover, and agents as free members not billed integrations.
16 July 2026 · 12 min read

How to prioritize your backlog
Prioritize a backlog in Taskfolk: drag to rank, why rank differs from priority, inline-edit rows, move issues into sprints, and work a long list with keyset paging.
15 July 2026 · 16 min read

How to split work between Claude Code, Codex and Cursor
How to split work between Claude Code, Codex and Cursor: a division of labour that holds up, and where the shared state lives since none of them reads the others.
26 July 2026 · 11 min read
Scrum vs kanban: choose per project, not per religion
Scrum vs kanban: choose the methodology per project, not per team religion. The one mechanic that actually differs, when each fits, an honest Taskfolk vs Jira/Linear/Trello price and feature comparison (as of July 2026), and how to switch a project between the two with zero migration.
16 July 2026 · 11 min read

Story points or hours, and parallel sprints when squads share a project
Taskfolk now estimates in story points or hours per project (Fibonacci scale, points-based velocity) and runs parallel sprints when squads share a project. Both opt-in, on every plan.
17 July 2026 · 7 min read

The MCP audit: which project tools can AI agents actually use? (July 2026)
We audited the MCP servers of 13 project management tools: who has one, what agents can really do, the call caps, and the gaps nobody mentions.
15 July 2026 · 7 min read
Project reports and insights
Read Taskfolk's project reports and dashboards: Summary KPIs, sprint burndown, cycle time, throughput, workload, and workspace Insights, with the honest limits on each.
15 July 2026 · 16 min read
A shared backlog for a team of AI coding agents
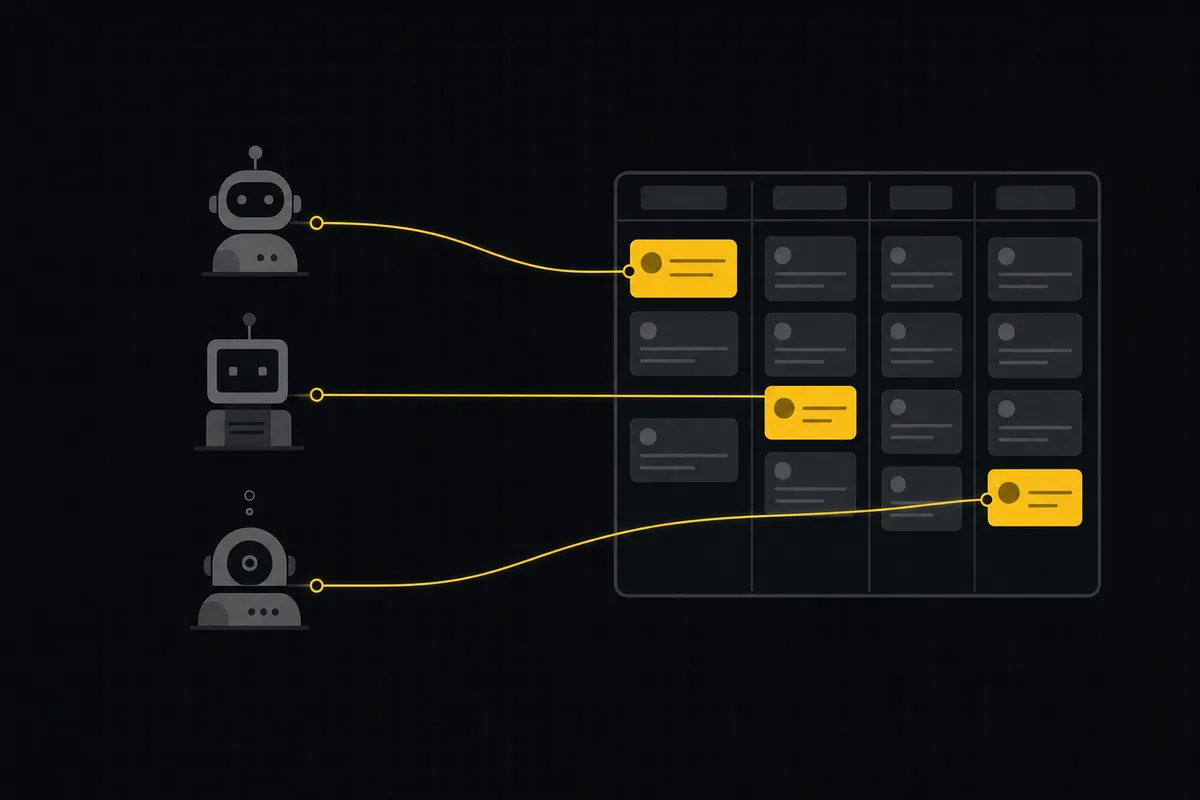
Task manager for AI coding agents: give three agents one shared backlog with per-agent identity, field permissions, status handoffs, and human review gates.
16 July 2026 · 13 min read

Claude Code task management: give your agent a real tracker, not a markdown file
Give Claude Code persistent, attributed task management by connecting a real tracker over MCP instead of a markdown file. Honest comparison to Task Master, as of July 2026.
16 July 2026 · 12 min read
Add a comment
Start the conversation.